Climate Change
Quick links:
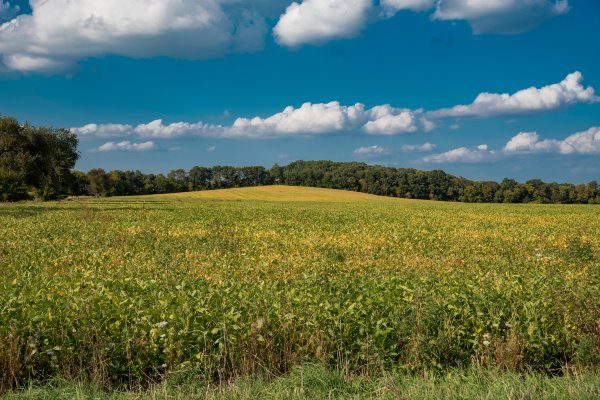
From improving livestock efficiency to managing farm woodlands, there is a range of practical and profitable ideas that could help you to cut your carbon footprint, improve farm efficiency and profitability, whilst also improving your farm’s environmental performance.
Useful Links


Publications
Natural Capital – Agri-Environment Climate Scheme (AECS) Read >

A View From Argentina Read >
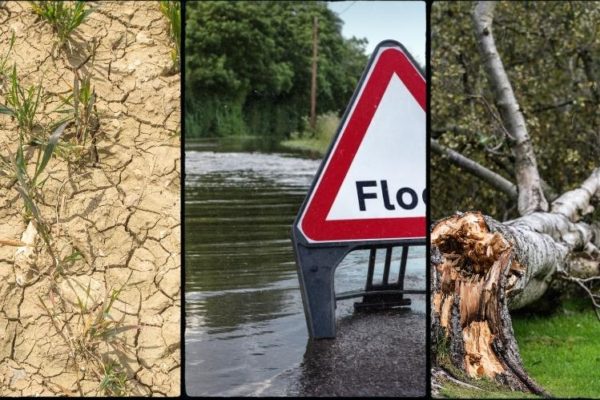
Rural Roundup – Picking out the Positives from Agricultural Sectors and Planning for Water Scarcity with SEPA Read >
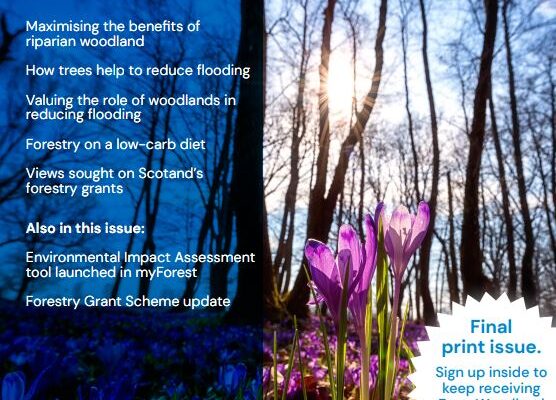
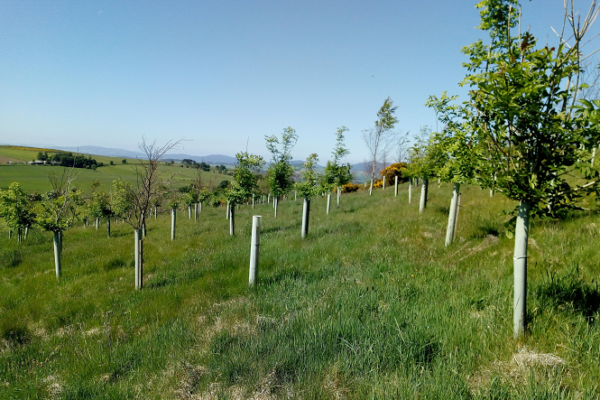
Farm Woodland News (FWN39) Spring 2023 Read >
Agribusiness News March 2023 Read >
The Trading Market for Farmland Carbon Read >


Useful links
Sign up to the FAS newsletter
Receive updates on news, events and publications from Scotland’s Farm Advisory Service